Multiple Choice
Identify the
choice that best completes the statement or answers the question.
|
|
|
1.
|
Make a mapping diagram for the relation.
{(–1, –5), (1, 4), (2, –4), (6, 1)}
|
|
|
2.
|
Write the ordered pairs for the relation. 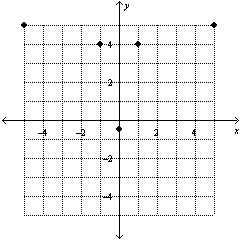 a. | {(–5, 5), (–1, 4), (0, –0.5), (1, 4), (5, 5)} | b. | {(5, –5), (4,
–1), (–0.5, 0), (4, 1), (5, 5)} | c. | {(–5, 5), (4, –1), (0, –0.5),
(1, 4), (5, 5)} | d. | {(5, –5), (–1, 4), (–0.5, 0), (4, 1), (5,
5)} |
|
|
|
3.
|
Graph the relation. Find the domain and range. 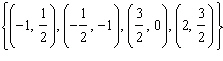
|
|
|
For each function, what is the output of the given input?
|
|
|
4.
|
For  ,  .
|
|
|
5.
|
For  ,  .
|
|
|
Determine whether y varies directly with x. If so, find the
constant of variation k and write the equation.
|
|
|
6.
|
a. | yes; k = 4; y =4x | c. | yes; k = 6; y
=6x | b. | yes; k = 3; y =3x | d. | no |
|
|
|
7.
|
a. | yes; k = 2; y = 2x | c. | yes; k = 7;  | b. | yes; k = 3;  | d. | no |
|
|
|
8.
|
a. | yes; k = 2.67; y =2.67x | c. | yes; k = 3; y
=3x | b. | yes; k = 2.5; y =2.5x | d. | no |
|
|
|
Find the value of y for a given value of x, if y varies
directly with x.
|
|
|
9.
|
If y = 2.52 when x = 8.4, what is y when x =
2.7?
|
|
|
10.
|
The distance traveled at a constant speed is directly proportional to the time
of travel. If Olivia traveled 112 miles in 3.5 hours, how many miles will Olivia travel in 8.9 hours
at the same constant speed?
a. | 99.6 mi | b. | 284.8 mi | c. | 172.8 mi | d. | 124.4
mi |
|
|
|
11.
|
The table shows the median home prices in Florida. What is the equation of
a trend line that models a relationship between time and home prices? Use the equation to
predict the median home price in 2020. | Year | 1940 | 1950 | 1960 | 1970 | 1980 | 1990 | 2000 | | Median Price($) | $25,600 | $36,800 | $58,200 | $60,600 | $88,700 | $95,400 | $110,100 | | | | | | | | |
a. | 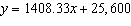 ; $110,100 ; $110,100 | c. |  ;
$138,300 ;
$138,300 | b. | 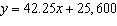 ; $110,100 ; $110,100 | d. |  ;
$138,300 ;
$138,300 |
|
|
|
12.
|
A cannery processed 1445 pounds of strawberries in 4.5 hours. The cannery
processed 2320 pounds in 7 hours. Write a linear equation to model the relationship between the
weight of strawberries S and time T. How many pounds of strawberries can be
processed in 11 hours?
a. | S = 350T + 130; 3980 lb | c. | T = 350S – 130;
3720 lb | b. | S = 350T – 130; 3720 lb | d. | S = 321T – 130; 3402
lb |
|
|
|
Graph the set of data. Decide whether a linear model is reasonable. If so,
draw a trend line and write its equation.
|
|
|
13.
|
{(1, 3), (–2, 1), (3,  ), (–4, –3), (0,
5)}
|
|
|
Let g(x) be the reflection of f(x) in the
y-axis. What is the function rule for g(x)?
|
|
|
14.
|
Let  be the reflection of  in the
y-axis. What is a function rule for  ?
|
|
|
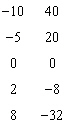
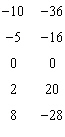
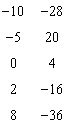
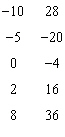
The function f(x) is represented by the given table. What
are the corresponding values of the given g(x)?
|
|
|
15.
|
The function  is represented by the table below. What are
the corresponding values of  for the transformation  ? a. | x
g(x)
 | c. |
x g(x)
 | b. | x
g(x)
 | d. |
x g(x)
 |
|
|
|
16.
|
Write an equation for the following transformation of  : a vertical stretch by a factor of 4
|
|
|
Find the function rule for g(x).
|
|
|
17.
|
The function  . The graph of  is 
vertically compressed by a factor of  and reflected in the x-axis. What is
the function rule for  ?
|
|
|
18.
|
The function  . The graph of  is  translated to the left 5 units and up 3 units. What is the function rule for
 ?
|
|
|
What transformations change the graph of f(x) to the graph of
g(x)?
|
|
|
19.
|
 ; 
|
|
|
What is the graph of the absolute value equation?
|
|
|
20.
|
|
|
|
21.
|
|
|
|
22.
|
|
|
|
Compare each function with the parent function. Without graphing, what
are the vertex, axis of symmetry, and transformations of the parent function?
|
|
|
23.
|
|
|
|
24.
|
|
|
|
25.
|
|
|
|
What is the graph of each inequality?
|
|
|
26.
|
3x + 2y > –5
|
|
|
27.
|
–2x + 2y £ –4
|
|
|
28.
|
|
|
|
29.
|
|
|
|
30.
|
A doctor’s office schedules 15-minute appointments and half-hour
appointments for weekdays. The doctor limits these appointments to, at most, 30 hours per week. Write
an inequality to represent the number of 15-minute appointments x and the number of half-hour
appointments y the doctor may have in a week.
|
|
|
What is the graph of each absolute value inequality?
|
|
|
31.
|
y < |x + 2| – 2
|
|
|
32.
|
–|x – 1| > y –
5
|
|
|
Write an inequality for the graph.
|
|
|
33.
|
a. | y ³ |x – 3| –
4 | c. | y ³ |x + 3| –
4 | b. | y £ |x + 3| –
4 | d. | y ³ |x + 3| + 4 |
|